Explore
Select
Sales

Talk to our team about rollout planning +1 (602) 318-1083

Support

Need help with a live account? support@routegeniusai.com

Business intelligence

From operations data to business decisions

Every route generates data: how many stops, how long at each stop, what supplies were used, when specimen was delivered, whether it was on time. RouteGeniusAI turns that data into dashboards, reports, and recommendations that help you run operations smarter and generate more revenue per route.

Dash

Real-Time Performance Dashboards

Visualize operations health with KPIs that matter: on-time delivery, stops per hour, cost per stop.

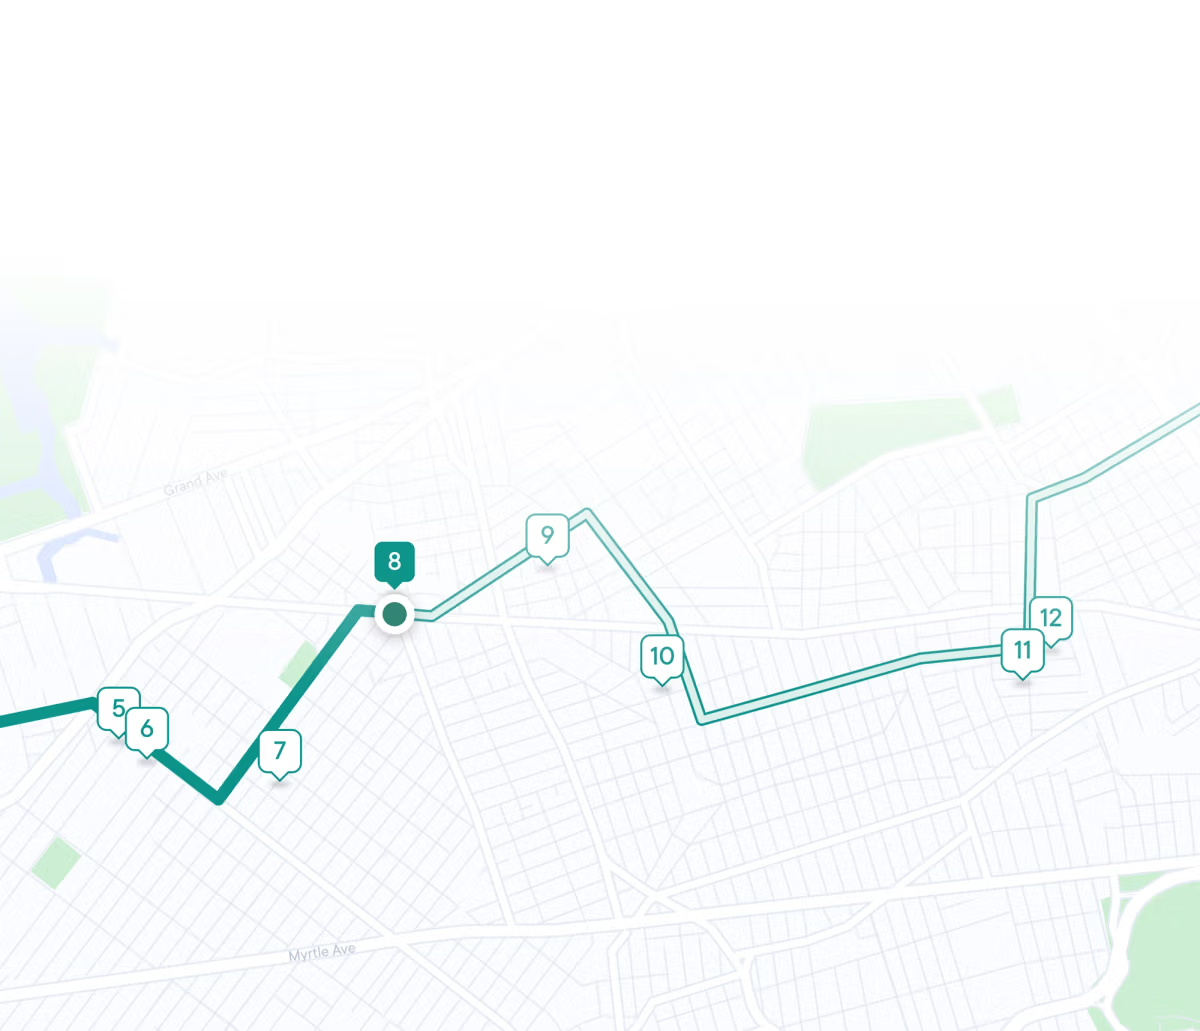
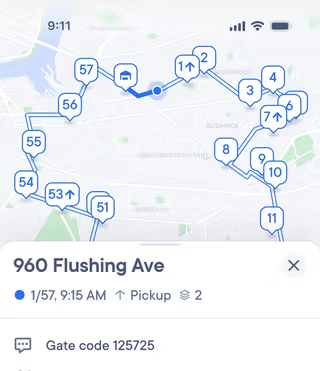
  • Dashboard shows current routes, pending orders, completed deliveries, and active exceptions.
  • KPI cards display on-time rate, average stops per hour, cost per stop, utilization percentage.
  • Historical trend charts show week-over-week and month-over-month improvement.
  • Drill-down capability: Click a metric to see which routes or drivers are underperforming.
  • Customizable view: Each user role sees metrics relevant to their decisions.
Real-time KPIs Trend analysis Drill-down detail Role-based views Customizable
Real-Time Performance Dashboards
Multi-dimensional visibility
Why it matters

Why It Matters: Operations blind spot = operations nightmare. You can't improve what you don't measure.

Market advantage

RouteGeniusAI Advantage: Dashboard is built into the platform, not a separate analytics tool bolted on.
Route

Route Efficiency & Cost Metrics

Calculate cost per stop, stops per hour, miles per delivery, and other efficiency indicators.

  • Cost per stop = Total route cost ÷ number of stops. See which routes are profitable, which are marginal.
  • Stops per hour trends show if teams are getting faster or slower over time.
  • Miles per delivery identifies inefficient routes (e.g., 2 stops in 20 miles = poor route).
  • Idle time tracking: Total time spent waiting, not driving or servicing.
  • Fuel cost breakdown (if integrated with fleet data) or labor cost allocation.
Cost per stop Stops/hour Miles/delivery Idle tracking Labor allocation
Route Efficiency & Cost Metrics
Cost visibility
Why it matters

Market Advantage: Competitors track individual metrics. RouteGeniusAI shows the relationships.

Market advantage

Example: Route A has 12 stops in 4 hours. Route B has 10 stops in 3 hours. Route B is more efficient.

Driver

Driver Utilization & Performance Analytics

Track driver productivity, on-time performance, and service quality without invasive monitoring.

  • Utilization score: % of time driver is actively servicing stops vs. idle/travel time.
  • On-time delivery percentage for each driver (how often they complete stops on schedule).
  • Average service time per stop (how long driver spends at each location).
  • Proof of delivery completion rate: Signatures, photos, or notes captured at each stop.
  • Exception tracking: How often driver faces delays, traffic, or facility issues.
Utilization % On-time rate Service time POD rate Exception tracking
Driver Utilization & Performance Analytics
Fair assessment
Why it matters

Why It Matters: Driver performance data enables fair recognition and targeted coaching.

Market advantage

RouteGeniusAI Approach: Metrics focus on outcomes (stops completed on time) not surveillance (GPS tracking every second).

Billing

Automated Billing with Consumable Tracking

Calculate revenue accurately: distance + time + supplies used = true cost of service.

  • Base billing on route distance and duration (standard components).
  • Add consumable costs: Supplies used per route (coolers, ice packs, labels, boxes, sterilization wipes).
  • Multi-customer billing rates: Different clinics or labs may have different rates or contracts.
  • Automated invoice generation: Billing calculated nightly, no manual reconciliation.
  • Profit margin visibility: See actual cost vs. billed amount for each route and customer.
Distance+time Consumables tracked Multi-rate billing Auto-invoicing Margin analysis
Automated Billing with Consumable Tracking
Revenue accuracy
Why it matters

Market Gap: Samsara tracks fuel costs. Competitors don't track consumables at all. That's where profit leakage happens.

Market advantage

RouteGeniusAI Unique: Drivers are assigned supplies (coolers, boxes) at shift start. System tracks what gets returned = what was used.

Comply

Compliance & Audit Reporting

Generate pre-built reports for CAP, CLIA, and healthcare audits without custom queries.

  • Chain of custody reports: Track every handoff, timestamp, and signature.
  • Driver credential reports: License verification, training completion, background check dates.
  • Vehicle maintenance logs: Service records, inspections, and safety compliance.
  • Temperature/cold chain reports: If integrated with cold storage, verify specimens stayed in acceptable ranges.
  • One-click export: PDF or Excel reports ready for auditors; no manual compilation.
Chain of custody Driver credentials Vehicle logs Cold chain Audit export
Compliance & Audit Reporting
Audit-ready
Why it matters

Why It Matters: Healthcare audits are routine. Manual report gathering takes 2-3 weeks.

Market advantage

RouteGeniusAI Advantage: All data is already in the system. One click generates audit-ready documentation.

Forecast

Predictive Insights for Planning

Use historical data to forecast demand, plan routes, and optimize resource allocation.

  • Forecast next week's volume based on historical patterns and current trends.
  • Recommend driver count and vehicle types needed for projected volume.
  • Identify peak hours and bottleneck locations (clinics that always have long service times).
  • Suggest route templates based on what worked well historically.
  • Alert when volume is trending outside normal range (opportunity to upsell or prepare for surge).
Volume forecast Resource planning Bottleneck ID Template suggestions Trend alerts
Predictive Insights for Planning
Data-driven planning
Why it matters

Market Advantage: Competitors offer reporting. RouteGeniusAI offers predictive recommendations.

Market advantage

Healthcare Use: Lab volumes fluctuate with seasons, day of week, and clinic schedules. Forecasting prevents understaffing or waste.